Owen Sound 's Expense Growth
expenses will more than double by
2026
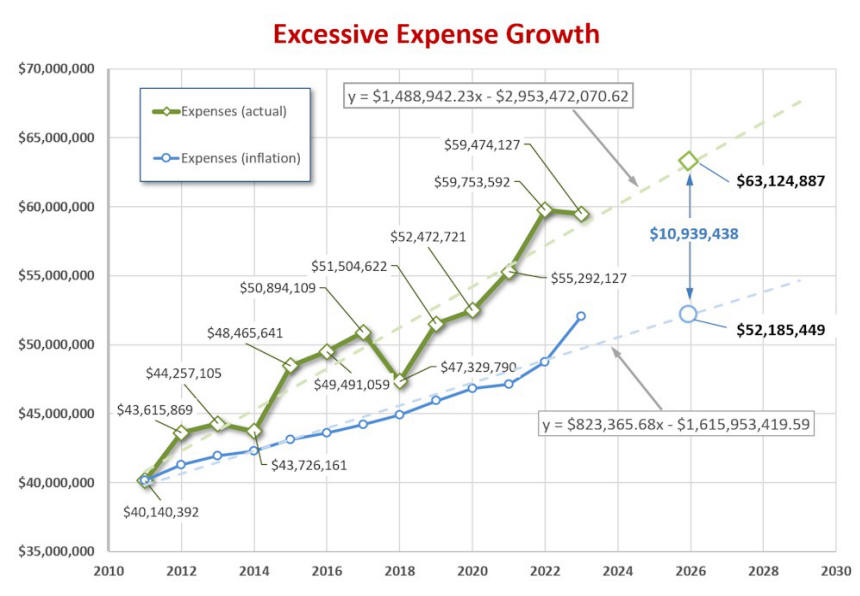
 City expenses increased by $19.3 million or
48.2% between 2011 and 2023 based on the city's Audited Financial Statements.
(As
of October 2025 the 2023 Statements are the latest posted on the city's website.) This was
over double the 19.6% increase in the Consumer Price
Index (CPI) for the same period.
City expenses increased by $19.3 million or
48.2% between 2011 and 2023 based on the city's Audited Financial Statements.
(As
of October 2025 the 2023 Statements are the latest posted on the city's website.) This was
over double the 19.6% increase in the Consumer Price
Index (CPI) for the same period.
The linear projection of expenses, shown as
dashed lines on the graph below, shows that expenses have been increasing steadily
at a rate of nearly $1.49 million per year. If Council continues on this path,
expenses are projected to reach $63.1 million by 2026. The 2026 budget will be
available in a few months so we will soon be able to measure the accuracy of
this forecast. If this holds true the City's Expenses will have
. . .
increased by
$22.98 million or 57.3%
in just 15 years while, Owen Sound's Population
reduced by 76 residents
during the same period
(population was 21,688 in
2011 and it is 21,612 today)
The Blue line shown on the graph above shows inflation
changed during the study period. If expenses had been held at the rate of
inflation the total expenses in 2023 would have been $52.1 million which is $7.4
million less that the $59.5 million that actually occurred.
So, why is this? When you examine
the detailed breakdown of the expense growth we can see that there are three
main contributors to this growth. They are:
-
Salaries and Benefits which grew by 38.4% or 8.2%
greater than inflation;
-
Amortization grew by 70.2% or 40% greater than
inflation, and
-
Materials and Supplies grew by a whopping 105% or 75%
greater than inflation.
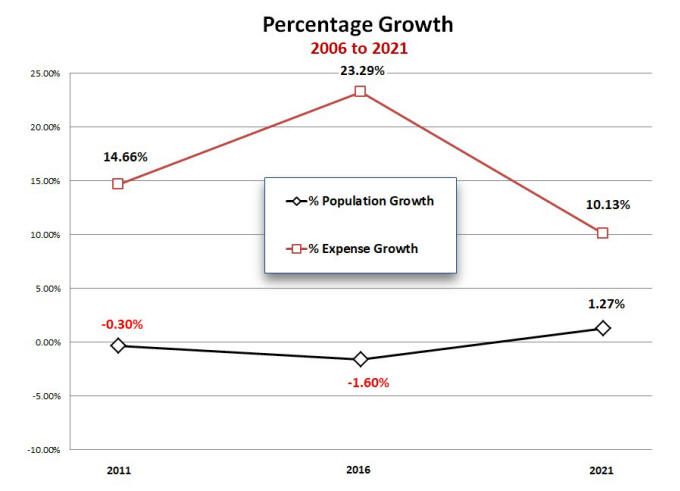
The census is taken every five years. From 2006 to 2011 our population
contracted by 0.30%. During the same period city expenses grew from $35.0
million to $40.1 million or an alarming 14.66%. If our 2026 forcast holds
true then city expenses will have ...
increased by
$28.1 million or 80.3%
between 2006 and 2026, a 20 year period,
while, Owen Sound's Population
reduced by 141 residents
during the same period
(population was 21,753 in
2006 and it is 21,612 today)
It is unreasonable to expect expenses to have been frozen at the 2006 level just
because our population was shrinking As we all know, the cost of products
and services go up a little every year. It is reasonable to expect our
city to cap
city expense growth at the same rate of inflation given that Owen Sound's
population is relatively stagnant. Had this been the case from 2006 than
Owen Sound taxpayers would have saved $10.9 million
over the 20 years to 2026.
The
Audited Financial Statements give us a high level of confidence in the results. However, as
currently constructed they do not provide sufficient visibility for us to see
how individual department budgets are growing. For example, the audited
financials show us statements for “Recreation and Cultural Services”
which includes the Library, the Art Gallery, the Bayshore and the Rec Centre.
However, the city 's audited financial statements are currently structured to
show only groups of departments, so the Rec Centre for example is lumped in with
the Library, the Art Centre and the Bayshore under the heading of “Recreation
and Cultural Services”. Therefore we have no idea how any of these
individual departments performed during the study period. Perhaps the city will
change this to give taxpayers more visibility in the future.
To drill down on the out of control expense growth we can examine a few annual budgets to identify unusual growth patterns.
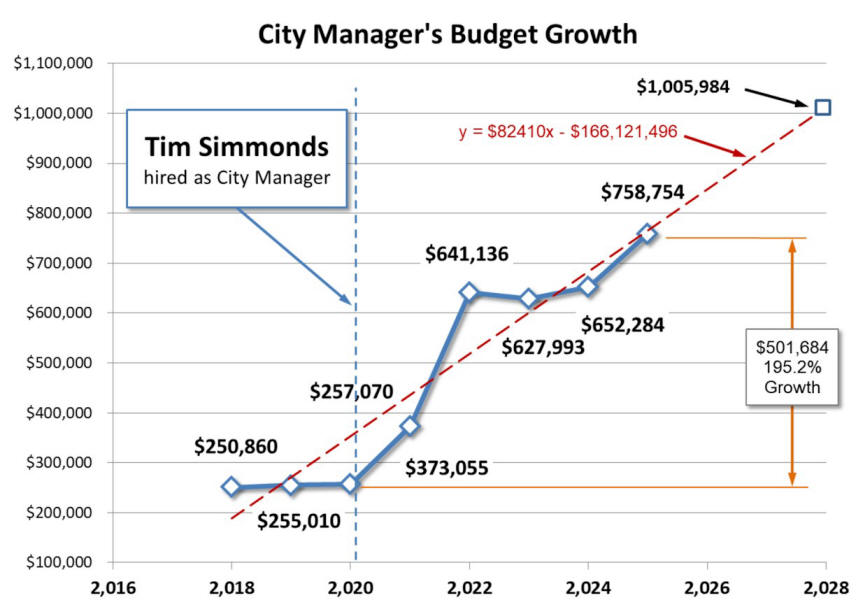
The two departments that standout when it comes to excessive growth are: the
City Manager's Office and the Art Gallery.
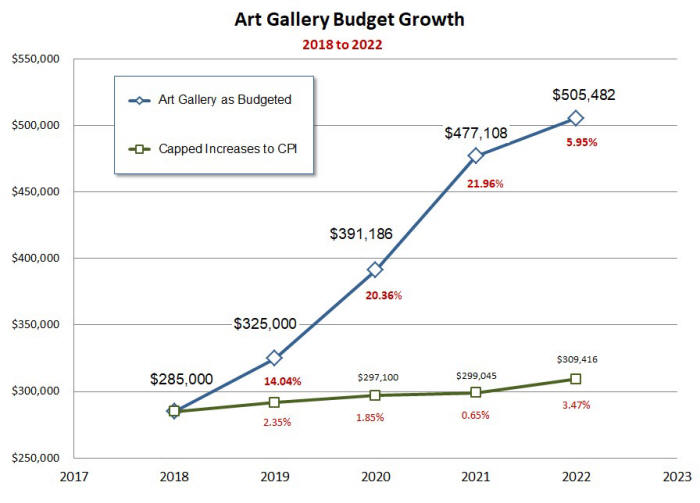
The graph above shows the cost to taxpayers for Art Gallery for a five year
period from 2018 to 2022. We can see in this graph that the Art Gallery 's burden
to taxpayers, during this five year period, actually grew by $220,482 or 77.3 %.
In fairness it's important to note that that the Gallery's cost to taxpayers has
level off at slightly less than the 2022 level.
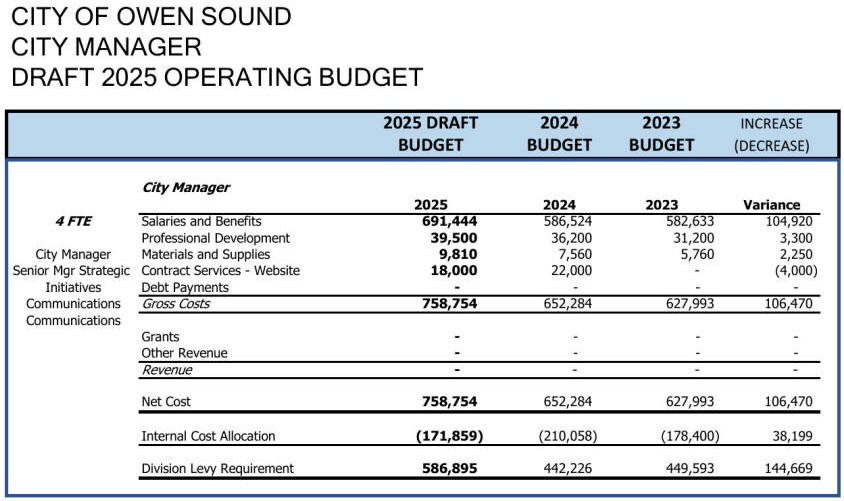
The city manager's office budget has traditionally been less that $280,000. In
2020 a new city manager was hired. In the five successive years Council
repeatedly approved annual increases to his budget in the order of 40% per year
resulting in the total budget growth of $501,684 or
195%. Take a look at the following graphics that pretty much speak for
themselves.